
IRV elections and Visualizing Outcomes
How IRV Counts Work
In Instant Runoff Voting (IRV) elections, voters rank candidates in order of preference. Initially, each candidate receives the votes where they are ranked first. The candidate with the least votes is eliminated, and their votes are transferred to the next preferred candidate on each ballot. This elimination process continues until one candidate has a majority and is declared the winner.
Example
Suppose there are 4 candidates: Alice, Bob, Chuan, and Diego. The votes are as follows:
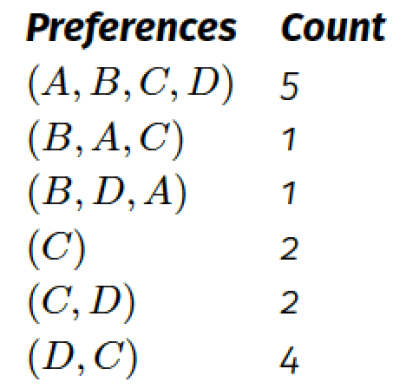
We first count the first preference tallies: Alice has 5 votes, Bob has 2, Chuan has 4, and Diego has 4. This means that Bob is eliminated first and his votes are distributed to the next-preferred candidate on each ballot—Diego gets the (B, D, A) vote and Alice gets the (B, A, C) vote. The new tallies are Alice: 6, Bob: eliminated, Chuan: 4, Diego: 5. Now Chuan is eliminated. Diego gains two more votes—the (C, D) ballots—and wins with 7 votes compared to Alice’s 6.
The full sequence of tallies is shown below.

Visualizing all possible IRV outcomes
Visualizing the possible outcomes of an Instant Runoff Voting (IRV) election is crucial to understanding how the process of elimination determines the winner. Since IRV involves multiple rounds of candidate eliminations, it’s helpful to use elimination trees to see all possible elimination sequences. Each elimination tree corresponds to a potential winner, showing the various paths by which a candidate could win the election.
An elimination tree is a hierarchical structure that represents the order in which candidates are eliminated in the election. The root of the tree represents the potential winner, and each branch represents a sequence of eliminations. At each level, a candidate is eliminated, and the remaining votes are redistributed according to the next preferences.
Example
For an election between candidates Alice, Bob, Chuan, and Diego, the top level of each of these elimination trees is shown below:

Consider the first node. This node represents all outcomes that end with Alice as the winner. Similarly, the second depicted node represents all outcomes that end with Bob as the winner. Each node in an elimination tree represents either a complete or a partial outcome. Nodes 1 to 4 in figure above represent partial outcomes as they do not express a complete elimination order.
Next we only consider the case where Alice is the winner. Figure below visualizes all elimination orders that end with Alice as the winner:

At the second level of the tree, we add a candidate as the runner-up. (The runner-up is the last candidate eliminated, though in IRV this is not necessarily the losing candidate who came closest to winning.) Node 4 represents all outcomes that end with Bob as the runner-up and Alice as the winner. In nodes 5 and 6, Chuan and Diego, respectively, are the runner-up candidates.
The third level of the tree identifies a candidate to be eliminated just prior to our runner-up. The leaves, on the fourth level, represent complete elimination orders. Node 13, for example, represents an elimination order in which Diego is eliminated first and Chuan second, leaving Bob as the runner-up, and Alice as the winner. Nodes 13–18 represent complete outcomes.
The tree captures all elimination orders that end with Alice as the ultimate winner. The complete set of alternate outcome trees that RAIRE considers is formed by a collection of such trees, one for each reported loser. To save space we often label each node with only the candidate eliminated at that step, rather than the whole elimination order. The whole order can be read by tracing up to the top. So each path up a tree represents an elimination order, with the first-eliminated candidate at the leaf and the winner at the top. We demonstrate this idea in the next example.
By sharing your files or using our service, you agree to our Terms of Service and Privacy Policy.